Anders Hesselbom
Programmerare, skeptiker, sekulärhumanist, antirasist.
Författare till bok om C64 och senbliven lantis.
Röstar pirat.
Dual coordinate systems
2009-11-27
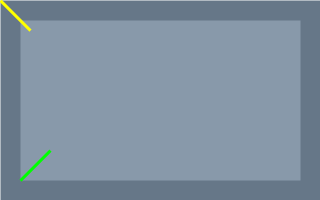
This picture illustrates the different coordinate systems that Monkeybone is using. Both lines are drawn from 0, 0 to 30, 30. The yellow line is drawn using the coordinate system of the image itself, and the green line is drawn using the coordinate system of the diagram.

The syntax is the same for DiagramLine and Line, the coordinate system is the only difference. This means that you can choose to use named arguments or points encapsulated by parenthesis. This is the source for the above image:
//Set size and background color.
Clear 320x200 #667788

//Just to make it more visible, set line thikness to 3 pixels.
Set Line Thikness To 3

//Create a diagram.
Diagram #8899aa X:20 Y:20 W:280 H:160

//Draw a yellow line on the image from 0,0 to 30,30.
Line #ffff00 (0,0) (30,30)

//Draw a green line on the diagram from 0,0 to 30,30.
DiagramLine #00ff00 (0,0) (30,30)
Note: A line can be anything from one to 1000 pixels wide.
Categories: General
Tags: Monkeybone
En kopp kaffe!
Bjud mig på en kopp kaffe (20:-) som tack för bra innehåll!


Leave a Reply