Anders Hesselbom
Programmerare, skeptiker, sekulärhumanist, antirasist.
Författare till bok om C64 och senbliven lantis.
Röstar pirat.
Monkeybone: Creating a bar diagram using Notepad part 3/4
2009-11-03
Continued from here.
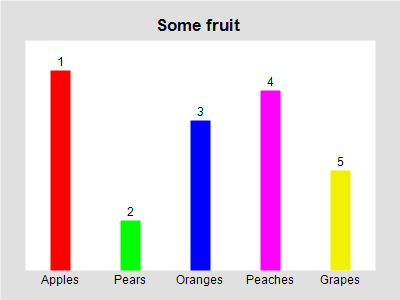
Text can be added below and above each bar. To add text below, use the Label argument. To add text above, use the Value argument. I show the complete file content below; the latest additions are highlighted with bold font. The text below each bar is a fruit name, and the text above are numbers. As diagram title, I have chosen Some fruit. The diagram title is a nameless argument. The code so far:
//Set image size and background color.
Clear 400x300 #e0e0e0

//Create a white diagram.
Diagram #ffffff X:25 Y:40 W:350 H:230 "Some fruit"

//Create 5 bars.
DiagramBar #ff0000 X:25  Y:0 W:20 H:200 Label="Apples"  Value="1"
DiagramBar #00ff00 X:95  Y:0 W:20 H:50  Label="Pears"   Value="2"
DiagramBar #0000ff X:165 Y:0 W:20 H:150 Label="Oranges" Value="3"
DiagramBar #ff00ff X:235 Y:0 W:20 H:180 Label="Peaches" Value="4"
DiagramBar #f2f200 X:305 Y:0 W:20 H:100 Label="Grapes"  Value="5"
This is the result:
To be concluded.
Categories: General
Tags: Monkeybone
One response to “Monkeybone: Creating a bar diagram using Notepad part 3/4”
Leave a Reply
En kopp kaffe!
Bjud mig på en kopp kaffe (20:-) som tack för bra innehåll!


Följ mig

|

|

|

|

[…] text. These files can be created by hand using any text editor, such as Notepad (shown here, here, here and […]